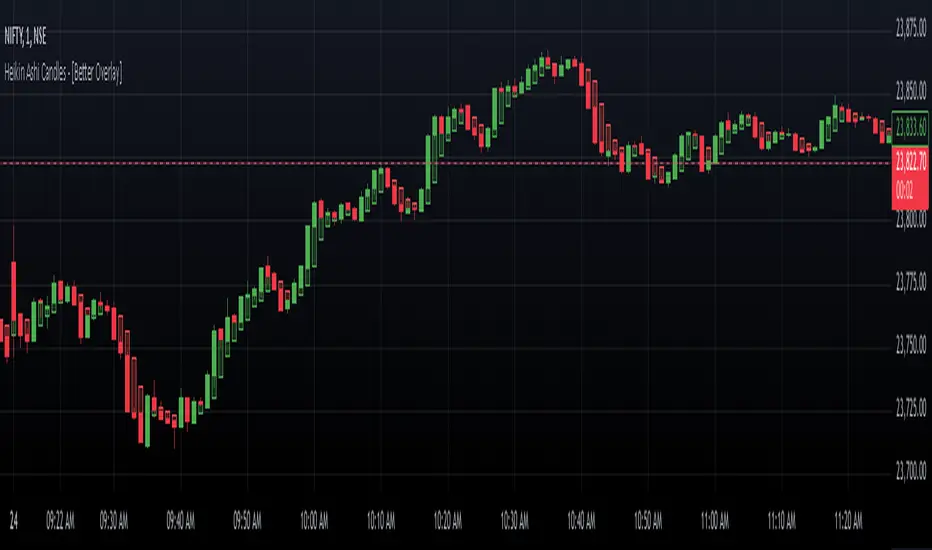
Heikin Ashi Candles - [Better Overlay]Heikin Ashi Candles - Better Overlay
Heikin Ashi candles are a unique charting technique designed to smooth price data, making it easier to identify trends and potential reversals. The "Heikin Ashi Candles - Better Overlay" indicator takes this concept further by introducing enhancements like a moving average based on the Heikin Ashi values and an overlay of actual price dynamics. This blog explores the functionality and features of this indicator.
Key Features
1. Heikin Ashi Candle Plotting
The indicator calculates Heikin Ashi values (open, high, low, and close) to plot candles directly on the chart. These candles provide a clearer view of market trends by reducing noise commonly seen in standard candlesticks.
- Heikin Ashi Close: The average of open, high, low, and close prices.
- Heikin Ashi Open: A smoothed value derived from the previous Heikin Ashi open and close values.
- Heikin Ashi High/Low: The highest and lowest prices between the Heikin Ashi open, close, and the actual high/low of the period.
The candle colors are intuitive:
- Green: Indicates bullish movement.
- Red: Indicates bearish movement.
The indicator uses semi-transparent candle bodies to ensure better visibility of the actual price chart underneath.
2. Heikin Ashi Moving Average
The indicator includes an optional moving average calculated from the Heikin Ashi values. This moving average helps traders identify the overall trend direction and its strength.
- The length of the moving average is adjustable via input settings.
- The color of the moving average line reflects its trend:
- Green: Uptrend.
- Red: Downtrend.
3. Dynamic Actual Price Line
To maintain a connection with real-time price data, the indicator overlays a dashed line representing the actual closing price of the asset. This feature provides valuable context when analyzing Heikin Ashi data, ensuring traders do not lose sight of the actual price levels.
Customization Options
The indicator offers several customization settings for better usability:
- Heikin Ashi Moving Average:
- Toggle to show or hide the moving average.
- Adjustable length for the moving average, ranging from 1 to 500 periods.
- Candle Styling:
- The colors and transparency levels of the candles are predefined to maintain chart clarity.
- Users can visually distinguish Heikin Ashi data from the actual price chart.
Practical Use Cases
1. Trend Identification
Heikin Ashi candles smooth out noise, making it easier to identify trends. Bullish and bearish candle coloring provides a quick visual cue for market sentiment.
2. Trend Strength and Reversals
The Heikin Ashi moving average serves as a reliable indicator of trend strength. A change in the color of the moving average can indicate a potential trend reversal.
3. Real-Time Price Reference
The dynamic price line ensures traders have a clear reference to the actual closing price, which is crucial for making informed decisions in real-time markets.
Conclusion
The "Heikin Ashi Candles - Better Overlay" indicator is a versatile tool for traders looking to combine the smoothing benefits of Heikin Ashi candles with the precision of real-time price data. Its additional features, like the Heikin Ashi moving average and dynamic price line, make it a comprehensive solution for both trend-following and real-time trading strategies.
This indicator is a great addition to any trader's toolkit, offering clarity and actionable insights without overcomplicating the chart. Give it a try to explore its potential in your trading journey.
Cerca negli script per "Heikin Ashi"
Heikin Ashi Colored Regular OHLC CandlesHeikin Ashi Colored Regular OHLC Candles
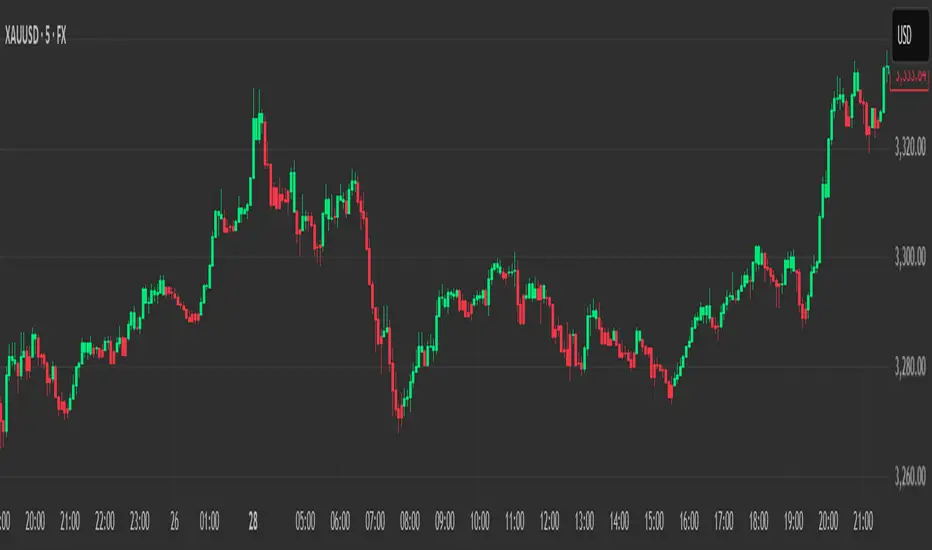
In the world of trading, Heikin Ashi candles are a popular tool for smoothing out price action and identifying trends more clearly. However, Heikin Ashi candles do not reflect the actual open, high, low, and close prices of a market. They are calculated values that change the chart’s structure. This can make it harder to see precise price levels or use standard price-based tools effectively.
To get the best of both worlds, we can apply the color logic of Heikin Ashi candles to regular OHLC candles. This means we keep the true market data, but show the trend visually in the same smooth way Heikin Ashi candles do.
Why use this approach
Heikin Ashi color logic filters out noise and helps provide a clearer view of the current trend direction. Since we are still plotting real OHLC candles, we do not lose important price information such as actual highs, lows, or closing prices. This method offers a hybrid view that combines the accuracy of real price levels with the visual benefits of Heikin Ashi trend coloring. It also helps maintain visual consistency for traders who are used to Heikin Ashi signals but want to see real price action.
Advantages for scalping
Scalping requires fast decisions. Even small price noise can lead to hesitation or bad entries. Coloring regular candles based on Heikin Ashi direction helps reduce that noise and makes short-term trends easier to read. It allows for faster confirmation of momentum without switching away from real prices. Since the candles are not modified, scalpers can still place tight stop-losses and targets based on actual price structure. This approach also avoids clutter, keeping the chart clean and focused.
How it works
We calculate the Heikin Ashi values in the background. If the Heikin Ashi close is higher than the Heikin Ashi open, the trend is considered bullish and the candle is colored green. If the close is lower than the open, it is bearish and the candle is red. If they are equal, the candle is gray or neutral. We then use these colors to paint the real OHLC candles, which are unchanged in shape or position.
Heikin-Ashi Mean Reversion Oscillator [Alpha Extract]The Heikin-Ashi Mean Reversion Oscillator combines the smoothing characteristics of Heikin-Ashi candlesticks with mean reversion analysis to create a powerful momentum oscillator. This indicator applies Heikin-Ashi transformation twice - first to price data and then to the oscillator itself - resulting in smoother signals while maintaining sensitivity to trend changes and potential reversal points.
🔶 CALCULATION
Heikin-Ashi Transformation: Converts regular OHLC data to smoothed Heikin-Ashi values
Component Analysis: Calculates trend strength, body deviation, and price deviation from mean
Oscillator Construction: Combines components with weighted formula (40% trend strength, 30% body deviation, 30% price deviation)
Double Smoothing: Applies EMA smoothing and second Heikin-Ashi transformation to oscillator values
Signal Generation: Identifies trend changes and crossover points with overbought/oversold levels
Formula:
HA Close = (Open + High + Low + Close) / 4
HA Open = (Previous HA Open + Previous HA Close) / 2
Trend Strength = Normalized consecutive HA candle direction
Body Deviation = (HA Body - Mean Body) / Mean Body * 100
Price Deviation = ((HA Close - Price Mean) / Price Mean * 100) / Standard Deviation * 25
Raw Oscillator = (Trend Strength * 0.4) + (Body Deviation * 0.3) + (Price Deviation * 0.3)
Final Oscillator = 50 + (EMA(Raw Oscillator) / 2)
🔶 DETAILS Visual Features:
Heikin-Ashi Candlesticks: Smoothed oscillator representation using HA transformation with vibrant teal/red coloring
Overbought/Oversold Zones: Horizontal lines at customizable levels (default 70/30) with background highlighting in extreme zones
Moving Averages: Optional fast and slow EMA overlays for additional trend confirmation
Signal Dashboard: Real-time table showing current oscillator status (Overbought/Oversold/Bullish/Bearish) and buy/sell signals
Reference Lines: Middle line at 50 (neutral), with 0 and 100 boundaries for range visualization
Interpretation:
Above 70: Overbought conditions, potential selling opportunity
Below 30: Oversold conditions, potential buying opportunity
Bullish HA Candles: Green/teal candles indicate upward momentum
Bearish HA Candles: Red candles indicate downward momentum
MA Crossovers: Fast EMA above slow EMA suggests bullish momentum, below suggests bearish momentum
Zone Exits: Price moving out of extreme zones (above 70 or below 30) often signals trend continuation
🔶 EXAMPLES
Mean Reversion Signals: When the oscillator reaches extreme levels (above 70 or below 30), it identifies potential reversal points where price may revert to the mean.
Example: Oscillator reaching 80+ levels during strong uptrends often precedes short-term pullbacks, providing profit-taking opportunities.
Trend Change Detection: The double Heikin-Ashi smoothing helps identify genuine trend changes while filtering out market noise.
Example: When oscillator HA candles change from red to teal after oversold readings, this confirms potential trend reversal from bearish to bullish.
Moving Average Confirmation: Fast and slow EMA crossovers on the oscillator provide additional confirmation of momentum shifts.
Example: Fast EMA crossing above slow EMA while oscillator is rising from oversold levels provides strong bullish confirmation signal.
Dashboard Signal Integration: The real-time dashboard combines oscillator status with directional signals for quick decision-making.
Example: Dashboard showing "Oversold" status with "BUY" signal when HA candles turn bullish provides clear entry timing.
🔶 SETTINGS
Customization Options:
Calculation: Oscillator period (default 14), smoothing factor (1-50, default 2)
Levels: Overbought threshold (50-100, default 70), oversold threshold (0-50, default 30)
Moving Averages: Toggle display, fast EMA length (default 9), slow EMA length (default 21)
Visual Enhancements: Show/hide signal dashboard, customizable table position
Alert Conditions: Oversold bounce, overbought reversal, bullish/bearish MA crossovers
The Heikin-Ashi Mean Reversion Oscillator provides traders with a sophisticated momentum tool that combines the smoothing benefits of Heikin-Ashi analysis with mean reversion principles. The double transformation process creates cleaner signals while the integrated dashboard and multiple confirmation methods help traders identify high-probability entry and exit points during both trending and ranging market conditions.

Heikin Ashi Processed Generalized Smooth StepDisclaimer : This is my attempt of smoothing and improving @tarasenko_ script. Find the originial author here :
Overview:
The Smooth Step Heikin Ashi Indicator is an enhanced version of the original script developed by tarasenko_. This advanced TradingView tool integrates Heikin Ashi candlestick calculations with a sophisticated smoothing oscillator, offering traders improved trend visualization and dynamic alert capabilities.
Key Enhancements:
Refined Heikin Ashi Calculations: The indicator computes smoothed Open, High, Low, and Close (OHLC) values with adjustable factors, allowing for more precise trend analysis. It also includes an optional second-level modified Heikin Ashi calculation for additional smoothing.
Advanced Smooth Step Oscillator: Utilizing Pascal’s triangle, this oscillator provides a visual representation of price momentum. Traders can configure the lookback period, equation order, and threshold to tailor the oscillator to specific trading strategies.
Enhanced Customization Options: Users can toggle between standard and Heikin Ashi candles, adjust smoothing parameters, and set display preferences to align with their analytical needs.
Noise Reduction: Smoothes out market fluctuations using customizable Heikin Ashi factors. Introduces a second-level smoothing option for even greater noise reduction, allowing traders to focus on the core trend.
Original Indicator :
Heikin Ashi processed version :
Visualization Features:
Heikin Ashi Candles: Displays candles with customizable colors and visibility settings, aiding in clearer trend identification.
Smooth Step Oscillator Line: Plots a line that reflects trend strength and momentum, assisting traders in making informed decisions.
Threshold Line: Provides a visual reference point to facilitate quick assessments of market conditions.
Conclusion:
Building upon tarasenko_'s original work, the Smooth Step Heikin Ashi Indicator delivers a robust tool for traders seeking refined market analysis. Its combination of advanced smoothing techniques and dynamic alert features makes it a valuable addition to any trader's toolkit.

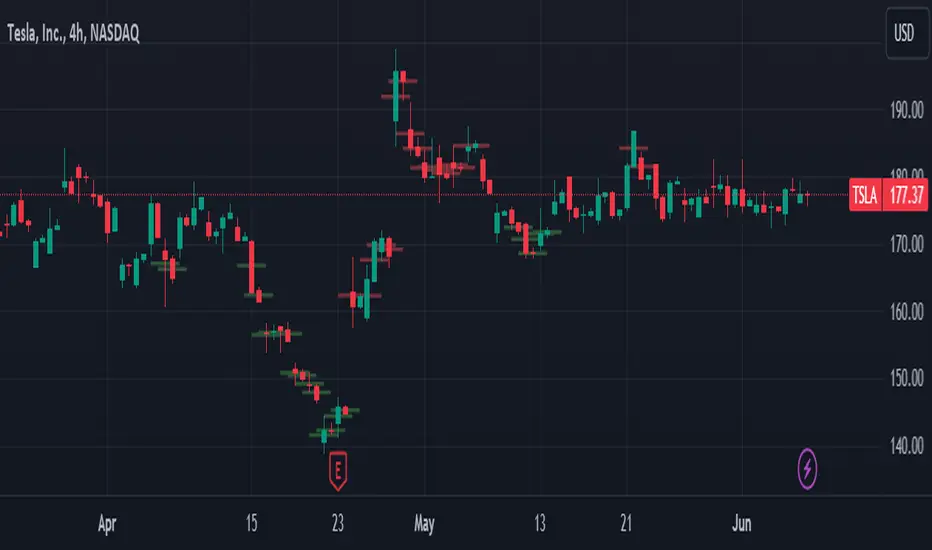
Heikin Ashi + MACD Momentum FilterThe Heikin Ashi + MACD Momentum Filter is designed for short-term and swing traders, combining the trend-smoothing capabilities of manually calculated Heikin Ashi candles with the momentum confirmation of the MACD histogram to generate reliable buy and sell signals. This indicator aligns trend direction with momentum shifts to minimize false signals, making it ideal for trading trending markets on timeframes like 5-minute to 1-hour charts.
How It Works
The indicator uses two technical components to produce signals:
Heikin Ashi for Trend Detection:
Heikin Ashi candles are manually calculated to smooth price action, with the close as the average of OHLC values and the open as the average of the previous Heikin Ashi open and close. These values are further smoothed over a default 5-period moving average. A bullish trend is confirmed when the smoothed Heikin Ashi close is above its open (plotted in green), and a bearish trend when the close is below the open (plotted in red). This smoothing reduces noise, helping traders stay in the direction of the prevailing trend.
MACD Histogram for Momentum Confirmation:
The MACD, calculated with standard settings (fast=12, slow=26, signal=9), produces a histogram. A buy signal requires the histogram to cross above a threshold (default: 0.0), indicating bullish momentum, while a sell signal requires a cross below, indicating bearish momentum. This ensures trades are taken when momentum supports the trend.
Signal Generation
Signals are generated using the previous bar’s values to prevent repainting:
Buy Signal: The MACD histogram crosses above the threshold, and the Heikin Ashi confirms a bullish trend. Displayed as a green upward triangle below the bar.
Sell Signal: The MACD histogram crosses below the threshold, and the Heikin Ashi confirms a bearish trend. Displayed as a red downward triangle above the bar.

Heikin-Ashi Band Proximity IndicatorHeikin-Ashi Band Proximity Indicator
Overview:
The Heikin-Ashi Band Proximity Indicator is a an analytical tool engineered to pinpoint critical price junctures where the Heikin-Ashi closing values align with the upper and lower thresholds of the Dynamic Adaptive Regression Bands . This indicator delineates these intersections through distinct green and red lines plotted over the last 100 candles, demarcating prospective support and resistance zones.
Purpose:
This indicator helps traders identify potential buy and sell zones based on proximity to dynamically calculated bands using Heikin-Ashi smoothed prices combined with linear regression and standard deviation calculations.
How It Works:
- Heikin-Ashi Transformation: Smooths price data to help isolate trends and reversals, reducing market noise and highlighting clearer trends.
- Regression Bands: Calculates the central regression line and deviations to form adaptive bands that act as dynamic levels of support and resistance.
- Color-Coded Indications: Green lines typically denote zones where prices may receive upward support, enhancing the likelihood of a price increase, while red lines suggest probable resistance zones where price pullbacks or stagnation are anticipated.
Trading Potential Application:
- Buy Signal: When the Heikin-Ashi close approaches the lower green band, it might indicate a potential upward reversal.
- Sell Signal: Conversely, proximity to the upper red band may suggest a downward reversal.
- Market Behavior: When prices diverge from these bands without surpassing them, they frequently revert to these levels, indicating that the bands serve as persistent attractors of price, exerting a gravitational pull over extended periods. This behavior underscores the bands' role in stabilizing price movements by establishing persistent points of reversion within the market's volatility landscape.
Calculation Details:
- ha_close is computed as the average of the open, high, low, and close, which smoothens the price series.
- Regression lines and deviations are calculated to create bands that adapt to recent price actions, providing dynamic support and resistance levels.
Usage:
Useful for traders looking for an indicator to enhance their decision-making by identifying potential entry and exit points based on price stability and volatility. The clear, color-coded system aids in quick decision-making under various market conditions.
Conclusion:
The Heikin-Ashi Band Proximity Indicator is invaluable for traders aiming to capitalize on price movements near critical levels. Its methodology provides a unique approach to understanding market dynamics and enhancing trading strategies.
Candle Stick UpdateHeikin ashi chart so powerful that you can understand trend direction easily. But sometimes, this type of chart doesn't update properly and make no sense on real time. So I made this script. You can now change candle stick style default to heikin ashi (default / modified version) on the real time default chart without switching heikin ashi chart. Enjoy traders!!! And don't forget to press the like button :)

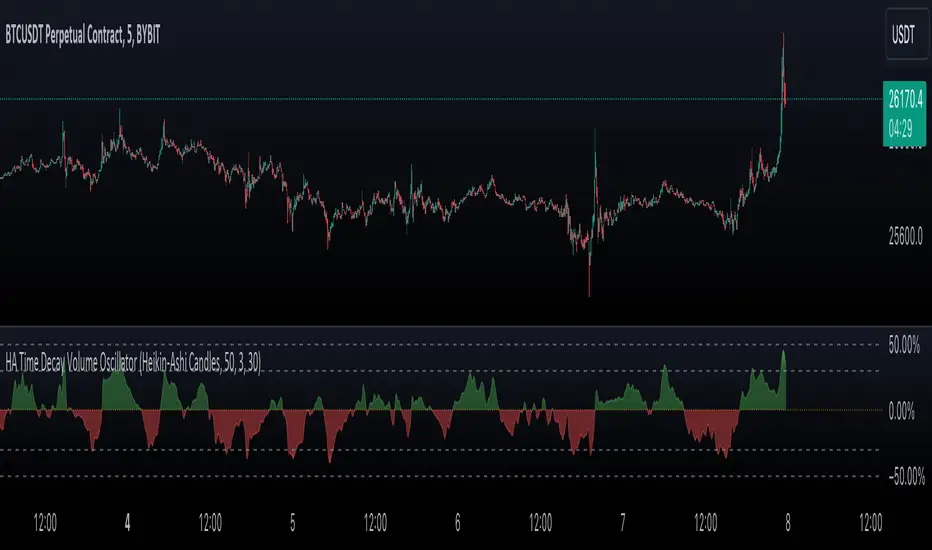
Heikin-Ashi-Candles MTFHeikin-Ashi Higher Timeframe Candles
This indicator overlays higher-timeframe Heikin-Ashi candles (default: 5 minutes) onto a lower-timeframe chart (e.g., 1 minute). Instead of using standard candlesticks, it draws:
Semi-transparent rectangles to represent the candle bodies.
Vertical lines to represent wicks, centered on each body.
Key features:
Dynamic transparency: The current, still-forming higher-timeframe candle is plotted in green or red (depending on trend) with a separate, lighter transparency (default: 30) so you can easily distinguish it from completed candles.
Finalization on close: As soon as a higher-timeframe candle closes, its body and wicks update to the standard transparency level (default: 50), ensuring completed candles are visually distinct.
Customizable inputs: You can adjust
The higher timeframe (tf) for Heikin-Ashi calculations.
Body transparency for confirmed candles.
Transparency for unfinished candles.
Wick thickness.
Use case:
This is particularly useful for traders who analyze price action on lower timeframes but want to stay aware of the higher-timeframe Heikin-Ashi trend without switching charts. The fading effect on the active candle helps prevent confusion between fully formed candles and those still developing.

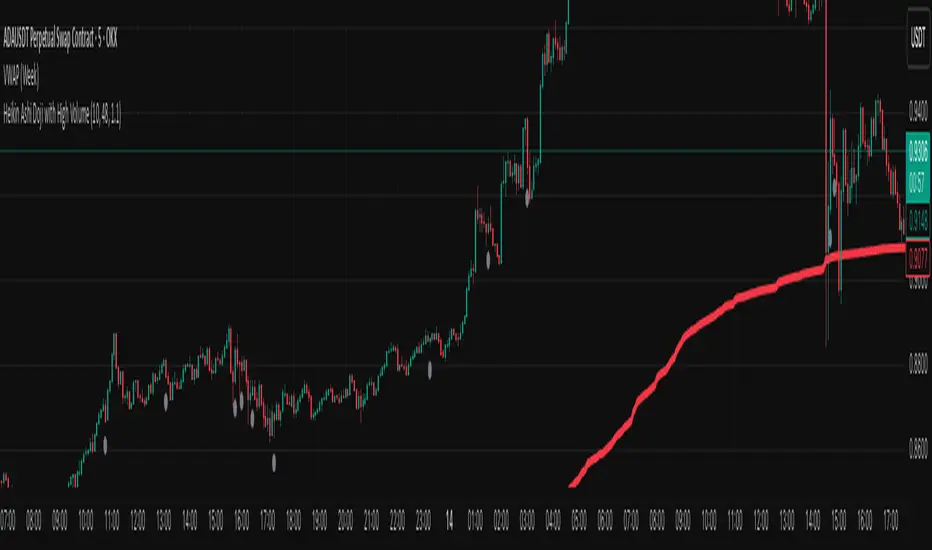
Heikin Ashi Doji with High VolumeThis indicator detects Heikin Ashi Doji candles that occur on unusually high volume.
A bar is marked when:
The Heikin Ashi candle body is small relative to the total range (below a configurable percentage threshold).
The volume is greater than a moving average of volume multiplied by a configurable factor.
Features:
Adjustable Doji body threshold (% of total range).
Adjustable volume MA length and volume multiplier.
Displays a gray circle below bars that meet both conditions.
Built-in alert condition so you can receive notifications when a high-volume Doji appears.
Usage Ideas:
High-volume Doji candles can indicate market indecision at key turning points. Combined with other analysis (e.g., support/resistance, VWAP, or trend tools), these signals can help identify potential reversals or pauses in price movement.
Note:
This tool uses Heikin Ashi calculations internally regardless of your chart’s candle type. The plotted dots correspond to the Heikin Ashi candle conditions, not the raw chart candles.
Heikin-Ashi Candle ColorOne of the biggest complaints about Heikin Ashi is the lack of real price data you receive. This attempts to give you as much information as possible by displaying both the candle color and the Heikin Ashi color. The wick takes on the original color while the body of the candle gets the Heikin Ashi color. The only downside to this method is that you do not get to see candle patterns. As always I hope you enjoy this release!

Heikin Ashi TSI and OTT [Erebor]TSI (True Strength Index)
The TSI (True Strength Index) is a momentum-based trading indicator used to identify trend direction, overbought/oversold conditions, and potential trend reversals in financial markets. It was developed by William Blau and first introduced in 1991.
Here's how the TSI indicator is calculated:
• Double Smoothed Momentum (DM): This is calculated by applying double smoothing to the price momentum. First, the single smoothed momentum is calculated by subtracting the smoothed closing price from the current closing price. Then, this single smoothed momentum is smoothed again using an additional smoothing period.
• Absolute Smoothed Momentum (ASM): This is calculated by applying smoothing to the absolute value of the price momentum. Similar to DM, ASM applies a smoothing period to the absolute value of the difference between the current closing price and the smoothed closing price.
• TSI Calculation: The TSI is calculated as the ratio of DM to ASM, multiplied by 100 to express it as a percentage. Mathematically, TSI = (DM / ASM) * 100.
The TSI indicator oscillates around a centerline (typically at zero), with positive values indicating bullish momentum and negative values indicating bearish momentum. Traders often look for crossovers of the TSI above or below the centerline to identify shifts in momentum and potential trend reversals. Additionally, divergences between price and the TSI can signal weakening trends and potential reversal points.
Pros of the TSI indicator:
• Smoothed Momentum: The TSI uses double smoothing techniques, which helps to reduce noise and generate smoother signals compared to other momentum indicators.
• Versatility: The TSI can be applied to various financial instruments and timeframes, making it suitable for both short-term and long-term trading strategies.
• Trend Identification: The TSI is effective in identifying the direction and strength of market trends, helping traders to align their positions with the prevailing market sentiment.
Cons of the TSI indicator:
• Lagging Indicator: Like many momentum indicators, the TSI is a lagging indicator, meaning it may not provide timely signals for entering or exiting trades during rapidly changing market conditions.
• False Signals: Despite its smoothing techniques, the TSI can still produce false signals, especially during periods of low volatility or ranging markets.
• Subjectivity: Interpretation of the TSI signals may vary among traders, leading to subjective analysis and potential inconsistencies in trading decisions.
Overall, the TSI indicator can be a valuable tool for traders when used in conjunction with other technical analysis tools and risk management strategies. It can help traders identify potential trading opportunities and confirm trends, but it's essential to consider its limitations and incorporate additional analysis for more robust trading decisions.
Heikin Ashi Candles
Let's consider a modification to the traditional “Heikin Ashi Candles” where we introduce a new parameter: the period of calculation. The traditional HA candles are derived from the open , high low , and close prices of the underlying asset.
Now, let's introduce a new parameter, period, which will determine how many periods are considered in the calculation of the HA candles. This period parameter will affect the smoothing and responsiveness of the resulting candles.
In this modification, instead of considering just the current period, we're averaging or aggregating the prices over a specified number of periods . This will result in candles that reflect a longer-term trend or sentiment, depending on the chosen period value.
For example, if period is set to 1, it would essentially be the same as traditional Heikin Ashi candles. However, if period is set to a higher value, say 5, each candle will represent the average price movement over the last 5 periods, providing a smoother representation of the trend but potentially with delayed signals compared to lower period values.
Traders can adjust the period parameter based on their trading style, the timeframe they're analyzing, and the level of smoothing or responsiveness they prefer in their candlestick patterns.
Optimized Trend Tracker
The "Optimized Trend Tracker" is a proprietary trading indicator developed by TradingView user ANIL ÖZEKŞİ. It is designed to identify and track trends in financial markets efficiently. The indicator attempts to smooth out price fluctuations and provide clear signals for trend direction.
The Optimized Trend Tracker uses a combination of moving averages and adaptive filters to detect trends. It aims to reduce lag and noise typically associated with traditional moving averages, thereby providing more timely and accurate signals.
Some of the key features and applications of the OTT include:
• Trend Identification: The indicator helps traders identify the direction of the prevailing trend in a market. It distinguishes between uptrends, downtrends, and sideways consolidations.
• Entry and Exit Signals: The OTT generates buy and sell signals based on crossovers and direction changes of the trend. Traders can use these signals to time their entries and exits in the market.
• Trend Strength: It also provides insights into the strength of the trend by analyzing the slope and momentum of price movements. This information can help traders assess the conviction behind the trend and adjust their trading strategies accordingly.
• Filter Noise: By employing adaptive filters, the indicator aims to filter out market noise and false signals, thereby enhancing the reliability of trend identification.
• Customization: Traders can customize the parameters of the OTT to suit their specific trading preferences and market conditions. This flexibility allows for adaptation to different timeframes and asset classes.
Overall, the OTT can be a valuable tool for traders seeking to capitalize on trending market conditions while minimizing false signals and noise. However, like any trading indicator, it is essential to combine its signals with other forms of analysis and risk management strategies for optimal results. Additionally, traders should thoroughly back-test the indicator and practice using it in a demo environment before applying it to live trading.
The following types of moving average have been included: "SMA", "EMA", "SMMA (RMA)", "WMA", "VWMA", "HMA", "KAMA", "LSMA", "TRAMA", "VAR", "DEMA", "ZLEMA", "TSF", "WWMA". Thanks to the authors.
Thank you for your indicator “Optimized Trend Tracker”. © kivancozbilgic
Thank you for your programming language, indicators and strategies. © TradingView
Kind regards.
© Erebor_GIT
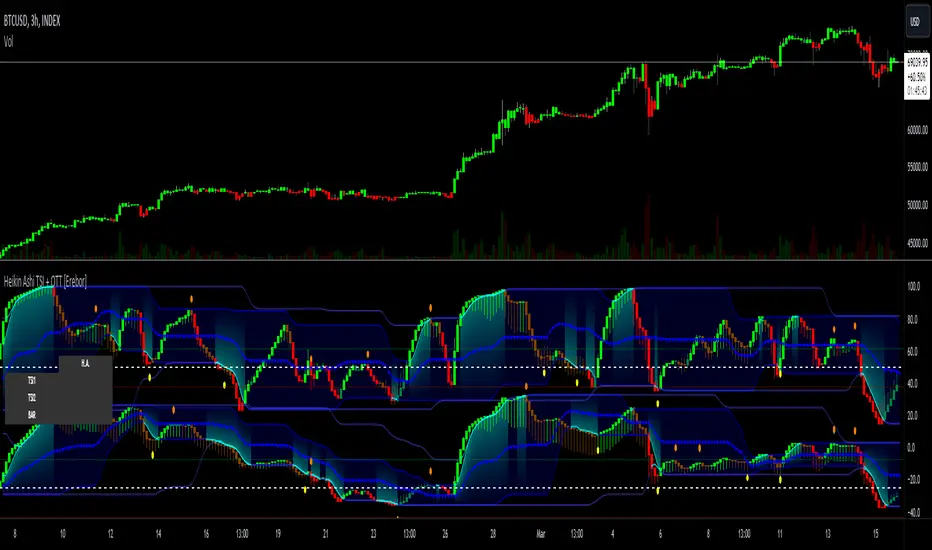
Heikin Ashi and Optimized Trend Tracker and PVSRA [Erebor]Heikin Ashi Candles
Let's consider a modification to the traditional “Heikin Ashi Candles” where we introduce a new parameter: the period of calculation. The traditional HA candles are derived from the open , high low , and close prices of the underlying asset.
Now, let's introduce a new parameter, period, which will determine how many periods are considered in the calculation of the HA candles. This period parameter will affect the smoothing and responsiveness of the resulting candles.
In this modification, instead of considering just the current period, we're averaging or aggregating the prices over a specified number of periods . This will result in candles that reflect a longer-term trend or sentiment, depending on the chosen period value.
For example, if period is set to 1, it would essentially be the same as traditional Heikin Ashi candles. However, if period is set to a higher value, say 5, each candle will represent the average price movement over the last 5 periods, providing a smoother representation of the trend but potentially with delayed signals compared to lower period values.
Traders can adjust the period parameter based on their trading style, the timeframe they're analyzing, and the level of smoothing or responsiveness they prefer in their candlestick patterns.
Optimized Trend Tracker
The "Optimized Trend Tracker" is a proprietary trading indicator developed by TradingView user ANIL ÖZEKŞİ. It is designed to identify and track trends in financial markets efficiently. The indicator attempts to smooth out price fluctuations and provide clear signals for trend direction.
The Optimized Trend Tracker uses a combination of moving averages and adaptive filters to detect trends. It aims to reduce lag and noise typically associated with traditional moving averages, thereby providing more timely and accurate signals.
Some of the key features and applications of the OTT include:
• Trend Identification: The indicator helps traders identify the direction of the prevailing trend in a market. It distinguishes between uptrends, downtrends, and sideways consolidations.
• Entry and Exit Signals: The OTT generates buy and sell signals based on crossovers and direction changes of the trend. Traders can use these signals to time their entries and exits in the market.
• Trend Strength: It also provides insights into the strength of the trend by analyzing the slope and momentum of price movements. This information can help traders assess the conviction behind the trend and adjust their trading strategies accordingly.
• Filter Noise: By employing adaptive filters, the indicator aims to filter out market noise and false signals, thereby enhancing the reliability of trend identification.
• Customization: Traders can customize the parameters of the OTT to suit their specific trading preferences and market conditions. This flexibility allows for adaptation to different timeframes and asset classes.
Overall, the OTT can be a valuable tool for traders seeking to capitalize on trending market conditions while minimizing false signals and noise. However, like any trading indicator, it is essential to combine its signals with other forms of analysis and risk management strategies for optimal results. Additionally, traders should thoroughly back-test the indicator and practice using it in a demo environment before applying it to live trading.
PVSRA (Price, Volume, S&R Analysis)
“PVSRA” (Price, Volume, S&R Analysis) is a trading methodology and indicator that combines the analysis of price action, volume, and support/resistance levels to identify potential trading opportunities in financial markets. It is based on the idea that price movements are influenced by the interplay between supply and demand, and analyzing these factors together can provide valuable insights into market dynamics.
Here's a breakdown of the components of PVSRA:
• Price Action Analysis: PVSRA focuses on analyzing price movements and patterns on price charts, such as candlestick patterns, trendlines, chart patterns (like head and shoulders, triangles, etc.), and other price-based indicators. Traders using PVSRA pay close attention to how price behaves at key support and resistance levels and look for patterns that indicate potential shifts in market sentiment.
• Volume Analysis: Volume is an essential component of PVSRA. Traders monitor changes in trading volume to gauge the strength or weakness of price movements. An increase in volume during a price move suggests strong participation and conviction from market participants, reinforcing the validity of the price action. Conversely, low volume during price moves may indicate lack of conviction and potential reversals.
• Support and Resistance (S&R) Analysis: PVSRA incorporates the identification and analysis of support and resistance levels on price charts. Support levels represent areas where buying interest is expected to be strong enough to prevent further price declines, while resistance levels represent areas where selling interest may prevent further price advances. These levels are often identified using historical price data, trendlines, moving averages, pivot points, and other technical analysis tools.
The PVSRA methodology combines these three elements to generate trading signals and make trading decisions. Traders using PVSRA typically look for confluence between price action, volume, and support/resistance levels to confirm trade entries and exits. For example, a bullish reversal signal may be considered stronger if it occurs at a significant support level with increasing volume.
It's important to note that PVSRA is more of a trading approach or methodology rather than a specific indicator with predefined rules. Traders may customize their analysis based on their preferences and trading style, incorporating additional technical indicators or filters as needed. As with any trading strategy, risk management and proper trade execution are essential components of successful trading with PVSRA.
The following types of moving average have been included: "SMA", "EMA", "SMMA (RMA)", "WMA", "VWMA", "HMA", "KAMA", "LSMA", "TRAMA", "VAR", "DEMA", "ZLEMA", "TSF", "WWMA". Thanks to the authors.
Thank you for your indicator “Optimized Trend Tracker”. © kivancozbilgic
Thank you for your indicator “PVSRA Volume Suite”. © creengrack
Thank you for your programming language, indicators and strategies. © TradingView
Kind regards.
© Erebor_GIT

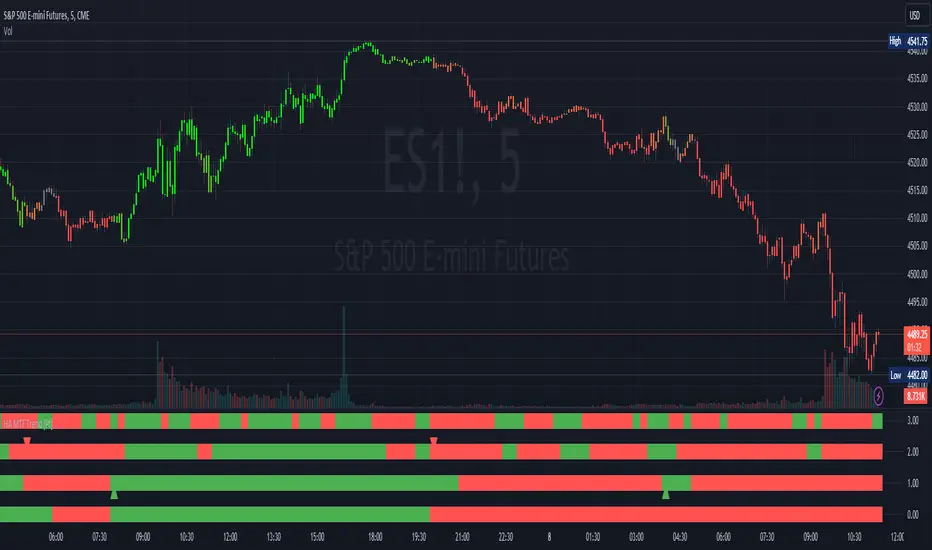
Heikin Ashi MTF Trend [Pt]█ Introduction
The Heikin Ashi MTF Trend indicator takes a simple approach to understand the trend by visualizing Heikin Ashi candle colors across multiple timeframes and representing it in a simple and visual manner. It utilizes the Heikin Ashi (HA) candles across four custom timeframes to detect trend shifts and strength. The indicator also offers alert conditions for potential bullish and bearish trend shifts.
█ Features
► Multiple Timeframes (MTF) Trend Detection: The script fetches HA data from four different timeframes. This multi-timeframe approach gives a holistic view of the market sentiment.
► Weighted Trend Score: The individual trend scores of the four timeframes are multiplied with their respective weights and summed up to provide a cumulative trend score that is used to determine bar colors and trend shifts.
► Visual Trend Depiction : It displays the trend using default green/red squares for each timeframe and a gradient-filled bar to represent the cumulative trend score.
► Trend Change Alerts: Users can set alerts for bullish and bearish trend shifts.
█ Alerts
◊ Bull Trend Signal Alert: Alert when there is a bullish trend shift.
◊ Bear Trend Signal Alert: Alert when there is a bearish trend shift.
█ Usage Tips
◊ The greater the discrepancy in the weights across the timeframes, the more emphasis is placed on the higher weighted timeframe.
◊ While the gradient bar provides a quick trend overview, it's essential to view the trend squares to understand the individual timeframe sentiments.
◊ Always consider using this tool in conjunction with other indicators or methods for confirmation and enhanced trading strategy.
Happy Trading~~
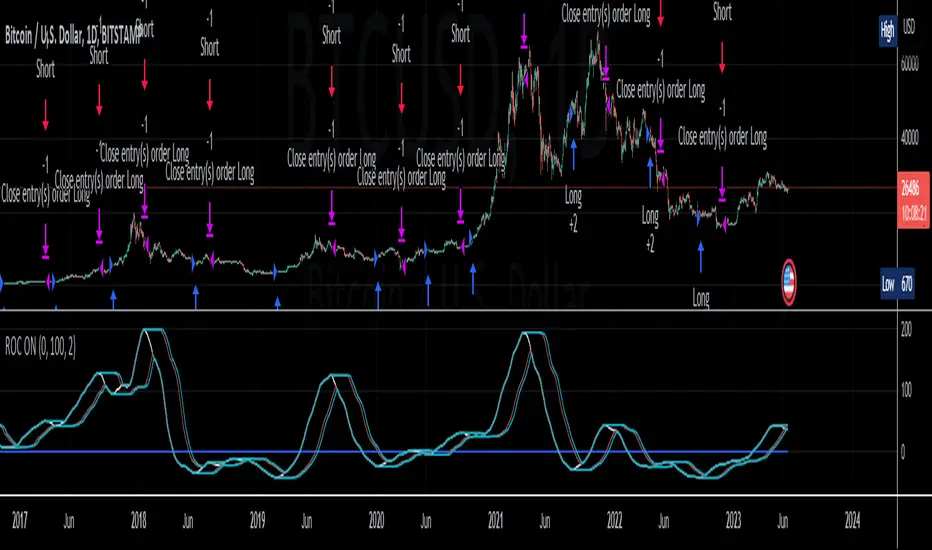
Heikin Ashi ROC Percentile Strategy**User Guide for the "Heikin Ashi ROC Percentile Strategy"**
This strategy, "Heikin Ashi ROC Percentile Strategy", is designed to provide an easy-to-use framework for trading based on the Heikin Ashi Rate of Change (ROC) and its percentiles.
Here's how you can use it:
1. **Setting the Start Date**: You can set the start date for the strategy in the user inputs at the top of the script. The variable `startDate` defines the point from which the script begins executing trades. Simply input the desired date in the format "YYYY MM DD". For example, to start the strategy from March 3, 2023, you would enter `startDate = timestamp("2023 03 03")`.
2. **Adjusting the Midline, Lookback Period, and Stop Loss Level**: The `zerohLine`, `rocLength`, and `stopLossLevel` inputs allow you to adjust the baseline for ROC, the lookback period for the SMA and ROC, and the level at which the strategy stops the loss, respectively. By tweaking these parameters, you can fine-tune the strategy to better suit your trading style or the particular characteristics of the asset you are trading.
3. **Understanding the Trade Conditions**: The script defines conditions for entering and exiting long and short positions based on crossovers and crossunders of the ROC and the upper and lower "kill lines". These lines are defined as certain percentiles of the ROC's highest and lowest values over a specified lookback period. When the ROC crosses above the lower kill line, the script enters a long position; when it crosses below the upper kill line, it exits the position. Similarly, when the ROC crosses below the upper kill line, the script enters a short position; when it crosses above the lower kill line, it exits the position.
In my testing, this strategy performed best on a day and hour basis. However, I encourage you to experiment with different timeframes and settings to see how the strategy performs under various conditions. Remember, there's no one-size-fits-all approach to trading; what works best will depend on your specific circumstances, goals, and risk tolerance.
If you find other useful applications for this strategy, please let me know in the comments. Your feedback is invaluable in helping to refine and improve this tool. Happy trading!
Heikin Ashi Candle OverlayHello Friend,
This is a very simple script for fun to demonstrate the new ability to change the colors of attributes pertaining to the plotbar() and plotcandle() functions using series inputs.
For Heiken Ashi lovers, this script does several things. It gives you both bars and hollow candles with Heikin Ashi values - something TV does not currently support.
It also gives you the ability to see your favorite HA candles while on the main series plot. When viewing indicators in the "Heikin Ashi" candle setting on TradingView, the input values are "smoothed' with HA values. This skews the way your indicators behave as the OLHC are calculated averages. Only the regular candle settings will give your indicators "real close" etc.
By 'Muting' the main series bars by toggling the 👁 symbol next to your ticker id, it makes the normal candles invisible. You then overlay this script, which allows you to see the HA Candle of your choice, while not affecting the way your indicators behave.
You now have the best of 2 worlds. Smoothed behavior of price action to help visualize trends, and accurate indicator values derived from actual OLHC data.
Plus, something about hollow HA candles is just kind of clean and soothing isn't it?
Cheers,
Bjorgum
Hollow Setting:
Bars
Or just plain old regular, but on the main chart

Heikin Ashi Buy-Sell Signals [Non-Repainting] @TradingadeThis is a basic indicator that displays Heikin Ashi candles in a simple format. Key features include:
- Unlike most other Heikin Ashi indicators, this one does not repaint, which is crucial when building strategies based on indicators.
- It generates Buy & Sell signals based on consecutive candles of the same color:
BUY Signal: Triggered when there are at least x green candles in a row (adjustable in settings).
SELL Signal: Triggered when there are at least x red candles in a row (also adjustable in settings).
Multiple Signal Option: If activated, the indicator will continue generating signals after the buy or sell condition is met, until a candle of the opposite color appears.
The Buy & Sell signals are shown both in the indicator and on your chart. You can turn them on or off in the style section.
You can set alerts when buy or sell signals are generated.

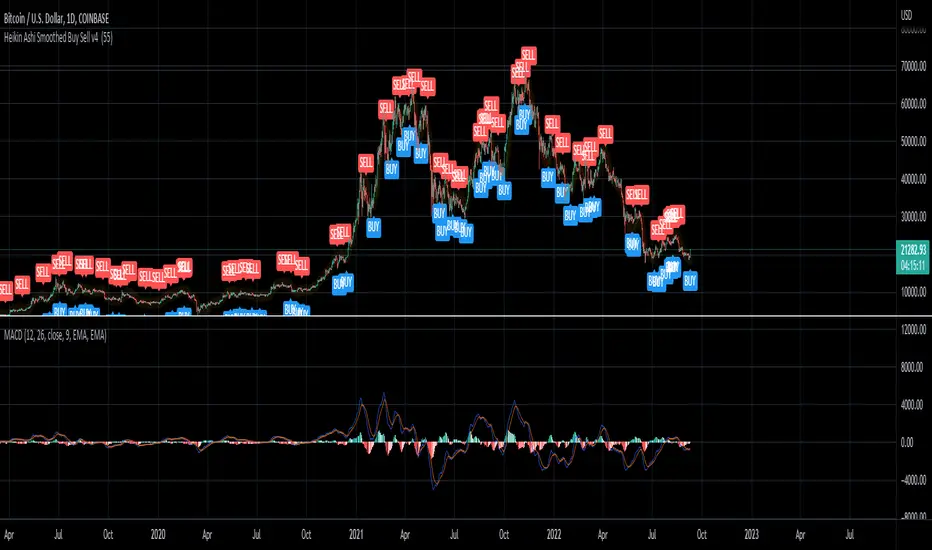
Heikin Ashi Smoothed Buy Sell (Sunseeder) I like to use it on the daily. This helps with indicating buy signals on the DXY, BITCOIN and ETH charts. You're able to customize the colors of the buy signals etc. Enjoy!
Heikin-Ashi Source Function HTFHigher TimeFrame using custom source function for toggling traditional Candle sources or Heikin-Ashi sources on a traditional Candles chart.
Thanks to PineCoders for rounding method: www.pinecoders.com
Thanks to @LucF and @RicardoSantos for their advice and enlightenment as always.
NOTICE: This is an example script and not meant to be used as an actual strategy. By using this script or any portion thereof, you acknowledge that you have read and understood that this is for research purposes only and I am not responsible for any financial losses you may incur by using this script!
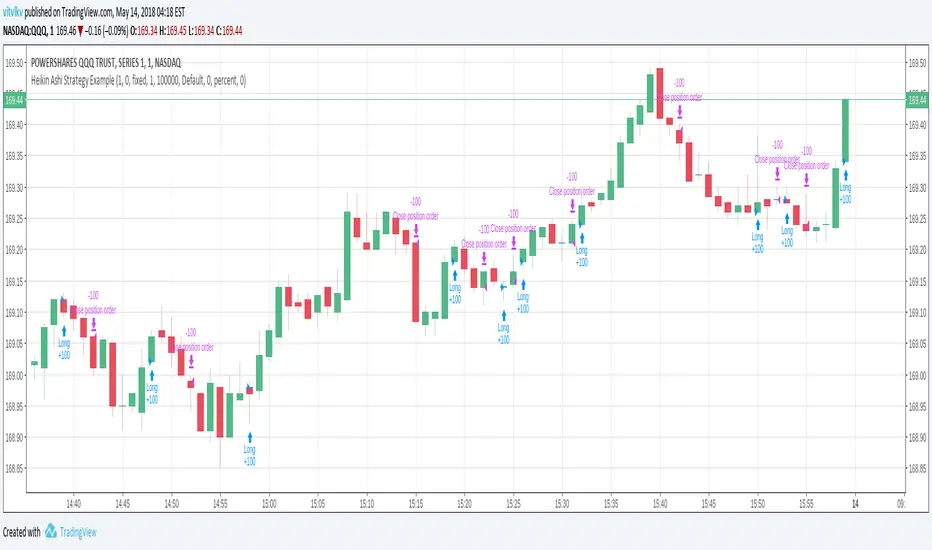
Heikin Ashi Strategy ExampleA strategy which calculates it's entry/exit conditions using HeikinAshi prices and executes orders using real prices (usual candles). NOTE that strategy should be added on a usual candles chart. Heikin Ashi prices are requested in the Pine code using 'security' function.
This is a possible solution to a question getsatisfaction.com =19502808#reply_19502808
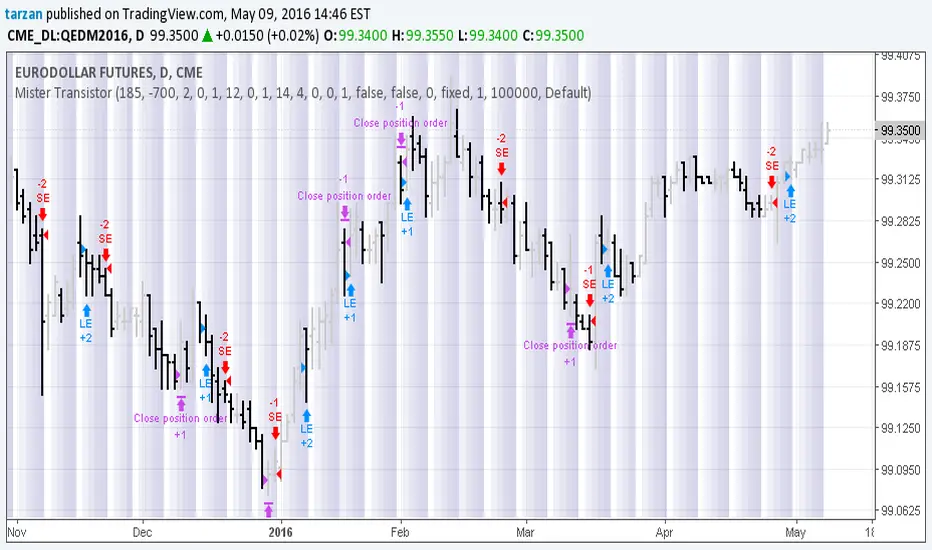
Mister Transistor 3.0This is a general purpose very flexible program to test the effectiveness of HA bars.
Please note that if you are charting at tradingview using Heikin-Ashi charting, your system will be trading fictitious prices even if you check the "use real prices" box. Thought you might like to know that before you lose all your money.
This program performs the HA calcs internally thus allowing you to use HA bars on a standard bar chart and obtaining real prices for your trades.
Courtesy of Boffin Hollow Lab
Author: Tarzan the Ape Man
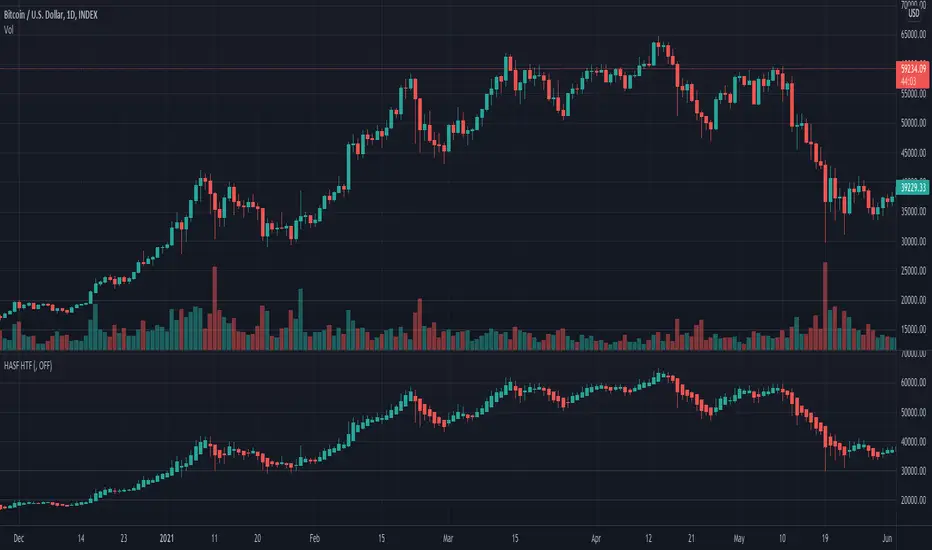
Heikin-Ashi Rolling Time Decay Volume OscillatorThe indicator calculates a time-decayed moving sum of volume data for both bullish (green) and bearish (red) candles. It then generates a volume share oscillator as a smoothed and weighted (time-decayed) moving sum of bullish volume (positive share) or bearish volume (negative share) relative to the total volume.
The volume share is displayed as an area chart with gradient fills representing overbought and oversold regions. Additionally, an Arnaud Legoux Moving Average (ALMA) of the volume oscillator is plotted on the chart.
Trend Momentum and Price Control :
This indicator serves as a powerful tool for traders to gauge trend momentum and identify which side, bulls or bears, is controlling price movements. When the volume oscillator trends strongly in the green territory, it suggests that bulls are in control of price movements, indicating a potential uptrend. Conversely, when the oscillator tilts into the red, it indicates bearish dominance and a potential downtrend. With the incorporation of ALMA for smoothing, this indicator becomes an essential tool for traders and analysts navigating the dynamics of traded assets.
Source Candles :
This indicator is designed to work with Heiken Ashi or Japanese candlesticks to discern candle bias, whether it's red or green. Heiken Ashi tends to produce red candles during downtrends and green candles during uptrends, providing a clearer trend indication. In contrast, traditional candlesticks alternate colors regardless of the dominant price direction. Users can select between "Heikin-Ashi Candles" and regular "Japanese Candles" as the source for price direction."
A time decay cumulative sum, also known as a weighted moving sum or exponentially weighted moving sum, offers several advantages when it comes to determining market dynamics compared to other methods:
Responsive to Recent Data: Time decay cumulative sum gives more weight to recent data points and gradually reduces the impact of older data. This responsiveness is crucial in rapidly changing market conditions where recent price and volume information is more relevant for analysis.
Adaptive to Market Volatility : It adapts to changes in market volatility. When markets are highly volatile, it places more emphasis on recent data to reflect the current market environment accurately. Conversely, during calmer periods, it considers older data less important.
Effective for Identifying Turning Points : Time decay cumulative sums are particularly effective at identifying turning points in market dynamics. They can indicate shifts from bullish to bearish sentiment and vice versa, providing early signals of potential trend reversals.
Reduces Lag : Traditional cumulative sums or simple moving averages can lag behind actual market changes, making them less effective for real-time decision-making. Time decay cumulative sums reduce this lag by giving more weight to recent events.
Dynamic Weighting: The weighting scheme can be adjusted to fit specific market dynamics or trading strategies. Traders can customize the decay rate or smoothing factor to align with their analysis goals and timeframes.
Improved Signal Clarity : The time decay cumulative sum can provide clearer and more precise signals for overbought and oversold conditions, as well as trend strength, due to its ability to emphasize recent relevant data.
In summary, a time decay cumulative sum is a valuable tool in determining market dynamics because it adapts to changing market conditions, reduces noise, and provides timely and accurate insights into trends, turning points, and the relative strength of bullish and bearish forces. Its responsiveness and adaptability make it an essential component of many technical analysis and trading strategies.
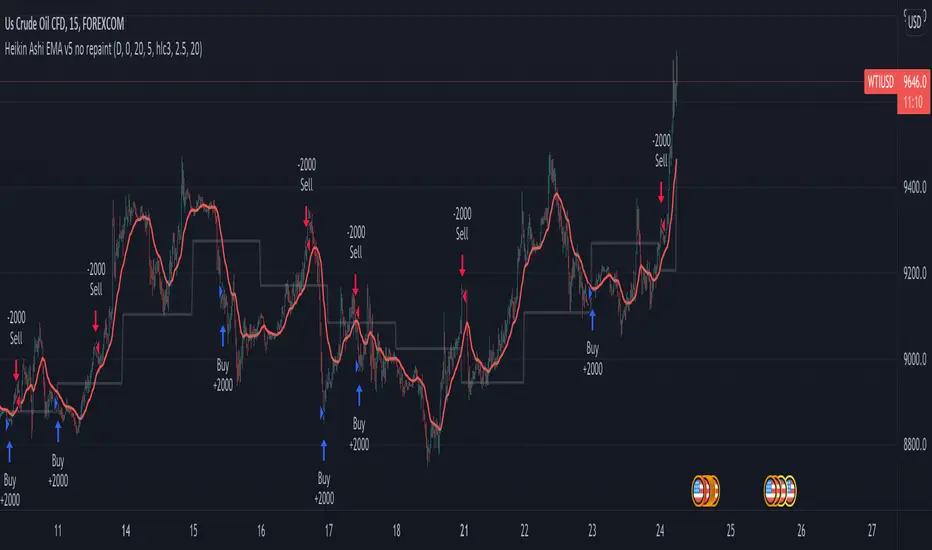
Heikin Ashi EMA v5 no repaint This script was inspired by the "Heikin/Kaufman Strategy" from marco valente built on v2.
The script was rebuilt on the v5 and most importantly removed the repaint function that was driving surrealistic backtesting inflated numbers.
This script is now fully functional and not repainting - At the time of testing worked efficiently 90% WR and 2x profit factor on CFD WTI OIL with a 15m time frame indexed on forex.com price.
You should utilize this script with caution, especially on high volatility cycles you can try plotting against a volatility relative index or stop.
I also strongly recommend understanding the fundamentals of WTI OIL to balance the indications of the strategy with fundamentals.
Thanks to Clovis Warlop and Nilesh Sharma for their contribution.
Cheers,
Gustavo Bramao
✅ Heikin Ashi Trend Reversal Confirmedusing the heikin ashi trend candles, this indicator can attempt to give buy and sell signals
